Summary
Immigrants received nearly half of all doctoral degrees issued in the U.S. in 2022. Despite their overrepresentation, immigrants are relatively average as doctorate recipients — neither the towering geniuses of advocates’ imagination nor the unqualified cheap labor that critics denounce. Current policy may cause natives to be crowded out of doctoral programs by foreign students whose skills are merely ordinary. Broader implications for “staple a green card” and other skill-based immigration proposals are discussed.
Introduction
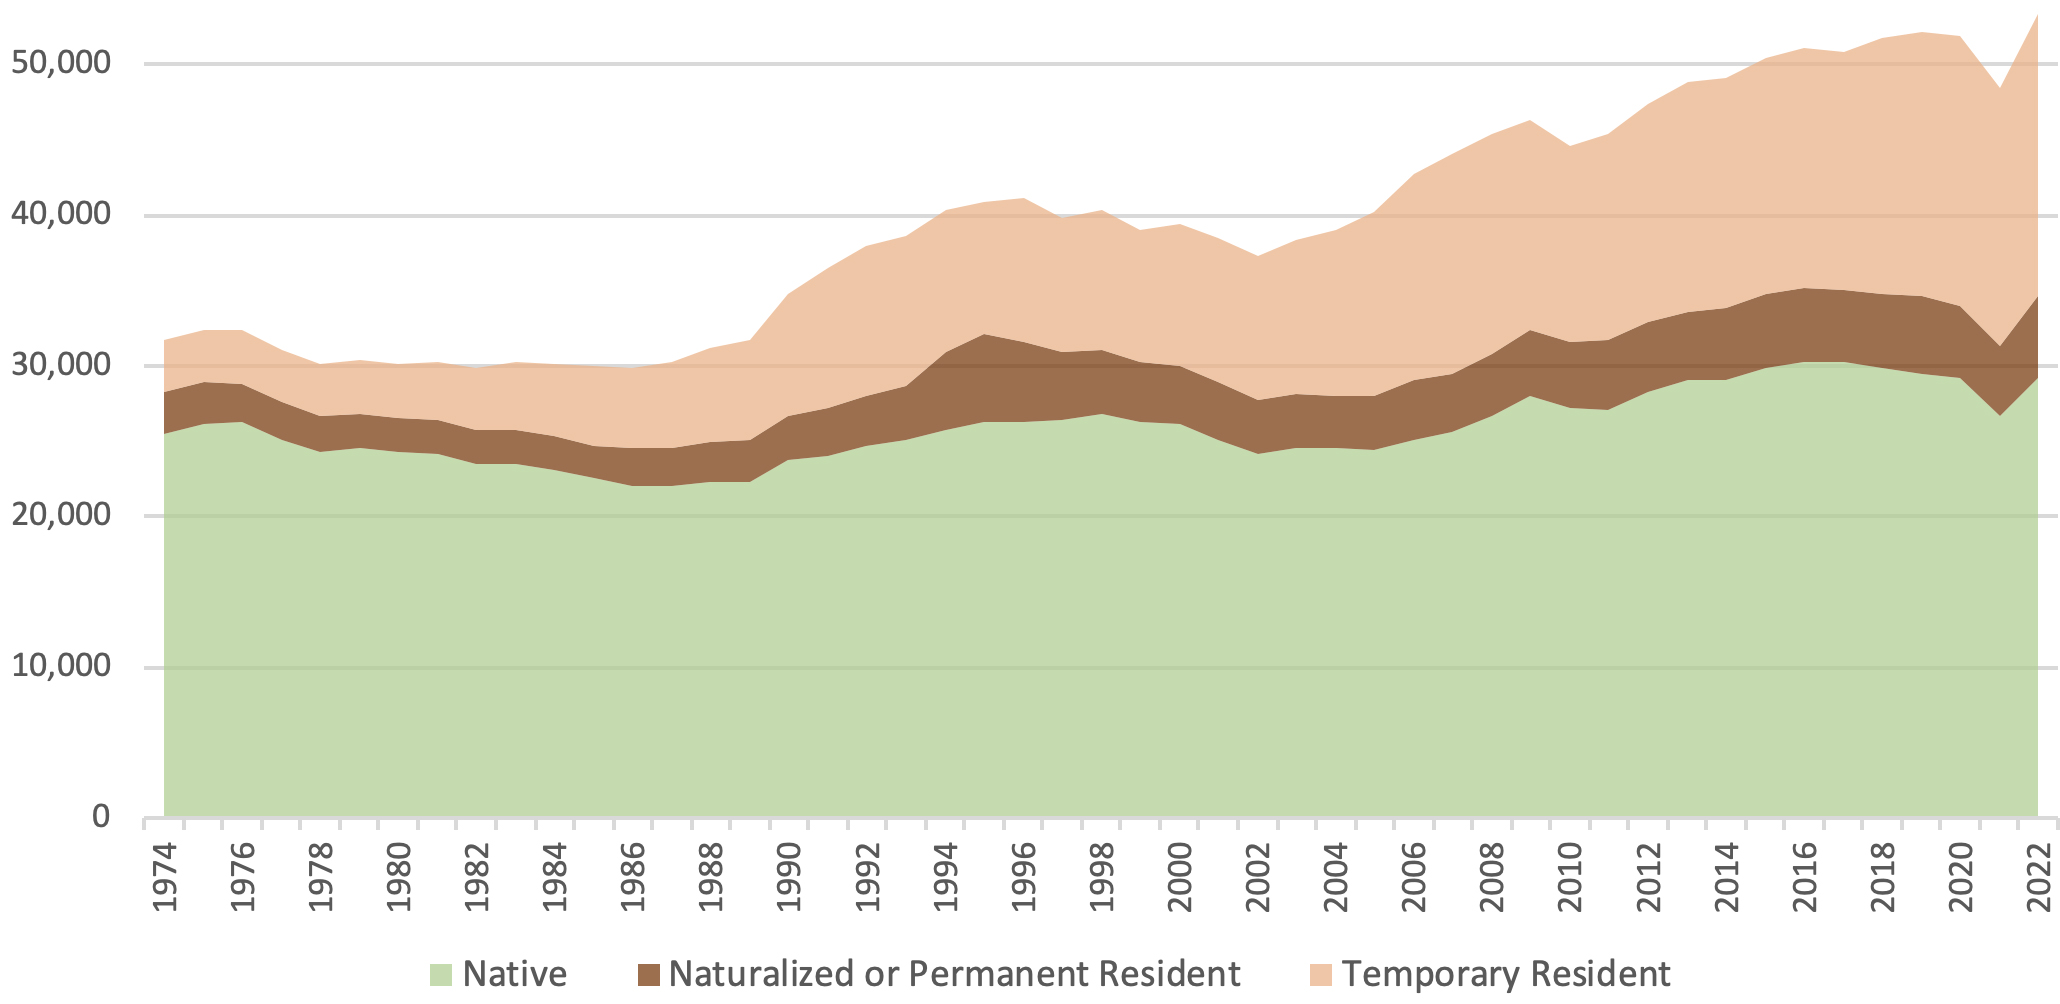
Anyone who has spent time in a university setting in the past few decades has probably noticed the large share of immigrants among the doctoral students there. The federal government’s Survey of Earned Doctorates (SED) confirms that observation. While the number of doctorates earned by natives has risen only slightly since 1974, the number of doctorates issued to immigrants has increased much more.1 This increase is overwhelmingly among temporary immigrants who likely have student visas. In fact, temporary immigrants received 35 percent of all doctorates in the U.S. in 2022, including 75 percent of immigrant doctorates.
Figure 1. New Recipients of Doctoral Degrees from U.S. Institutions, by Year |
 |
|
Source: Survey of Earned Doctorates. |
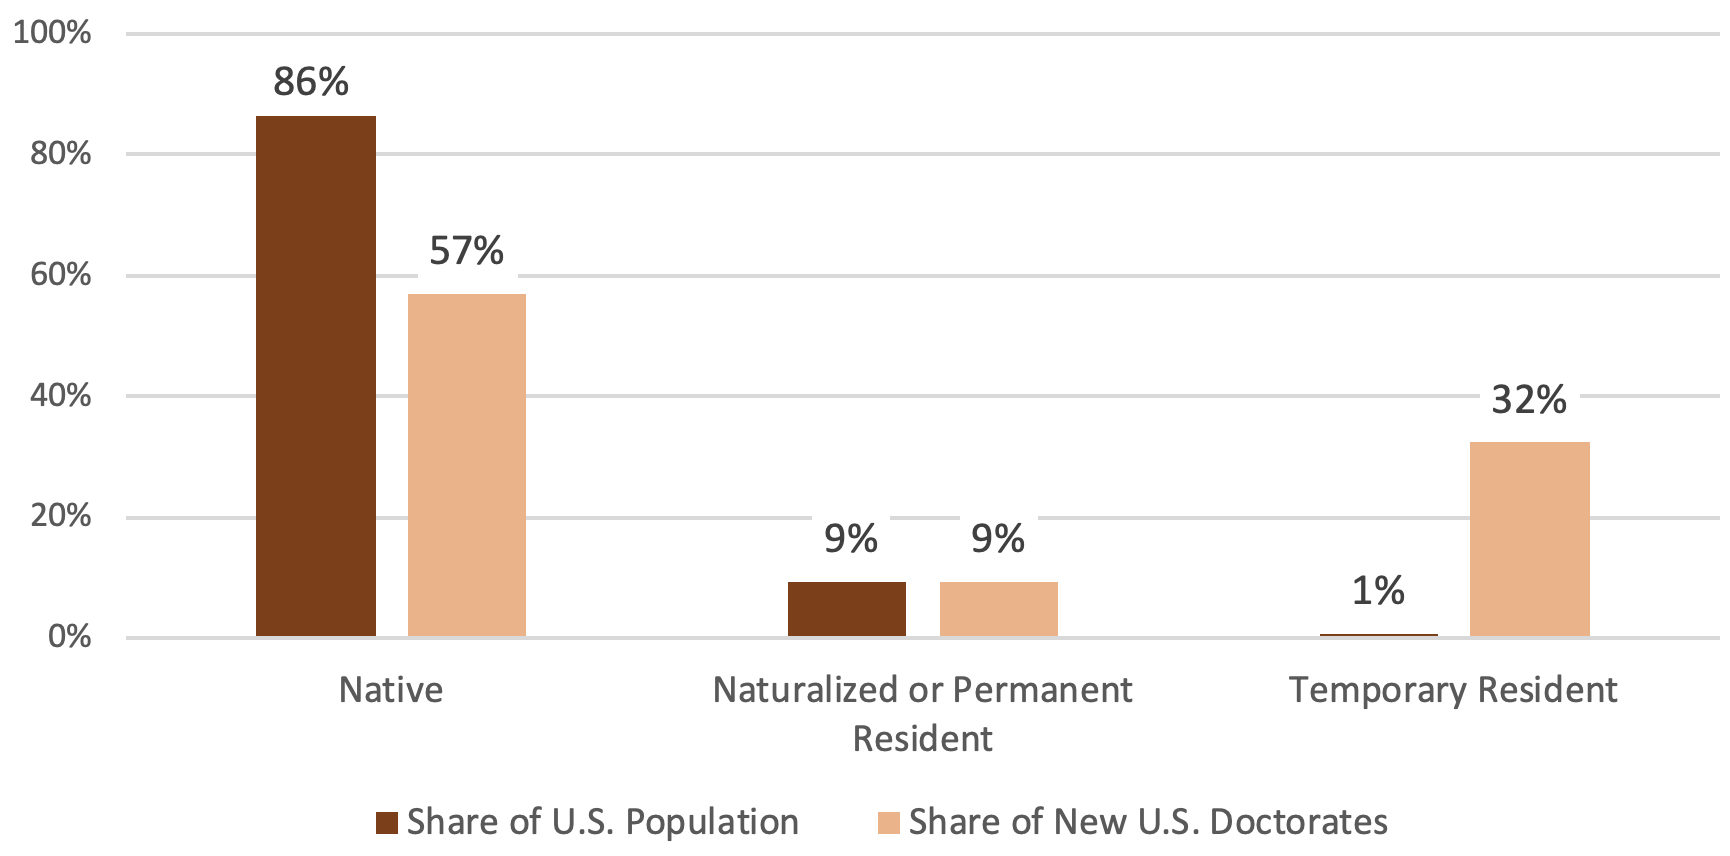
The student visa program naturally leads to immigrants earning a share of U.S. doctorates that exceeds their share of the population. Figure 2 quantifies the effect by combining SED data with the 2018 American Community Survey (ACS) and population figures published by the Department of Homeland Security (DHS).2 Natives are underrepresented among U.S. doctorate recipients, while naturalized or permanent resident immigrants receive a proportional share, and temporary immigrants are vastly overrepresented due to student visas.
Figure 2. Representation Among Doctorate Recipients in 2018 |
 |
|
Source: Survey of Earned Doctorates, American Community Survey, Department of Homeland Security. |
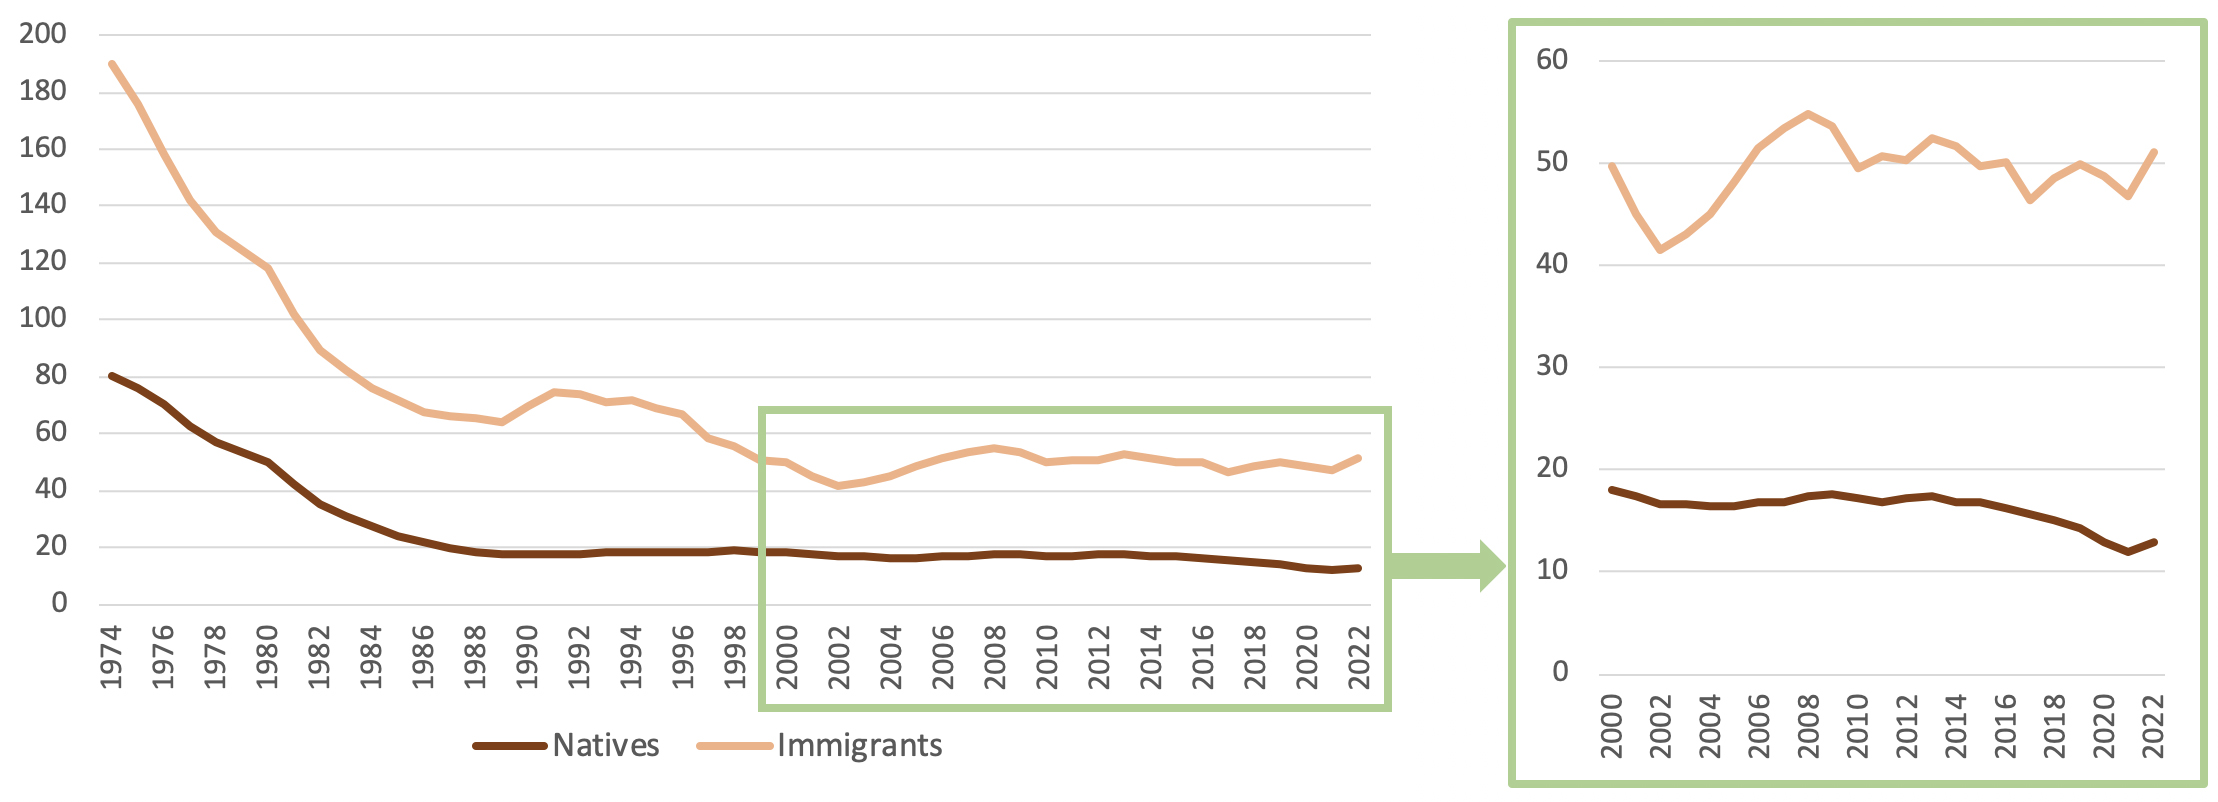
We can also examine the proportion of immigrants who receive doctorates compared to natives over time. Figure 3 shows that immigrants who are “doctorate-ready” — that is, they are college graduates in the prime doctorate-earning age range of 26 to 40 — are consistently more likely to earn doctorates than comparable natives. After the share with doctorates fell throughout the 1970s and 1980s, rates began to flatten for both groups. Interestingly, however, the inset on Figure 3 reveals a recent downward trend among natives. In 2000, about 18 in every 10,000 doctorate-ready natives earned a doctorate, compared to 13 per 10,000 in the 2022. By contrast, the share of doctorate-ready immigrants who receive doctorates appears to be stabilizing at around 50 per 10,000.3
Figure 3. Receipt of Doctoral Degrees Per 10,000 "Doctorate-Ready" Individuals |
 |
|
Source: Survey of Earned Doctorates, American Community Survey (2001+), Decennial Census (pre-2001). Population counts between the decennial censuses are interpolated. "Doctorate-ready" people are ages 26-40 and have at least a bachelor's degree. |
Allowing immigrants to have such an outsized role in U.S. doctoral programs may have significant economic, cultural, and even national security impacts. Before addressing those impacts, however, it’s necessary to answer a more basic question: Just how skilled are immigrants with U.S. doctorates?
Comparative Skills
Previous research from the Center shows that foreign-educated immigrants are significantly less skilled than natives who earn the same type of degree in the U.S.4 The skills gap is due to the widely varying standards for academic degrees in foreign countries. Therefore, when immigrants receive their highest degree in a U.S. institution instead of abroad, we should expect less of an immigrant-native skills gap. In fact, if immigrants with doctorates represent “the world’s best and brightest”, as some boosters claim, then we might expect them to have greater skills than natives with doctorates. This report compares skills using test scores, wages, and patent production.
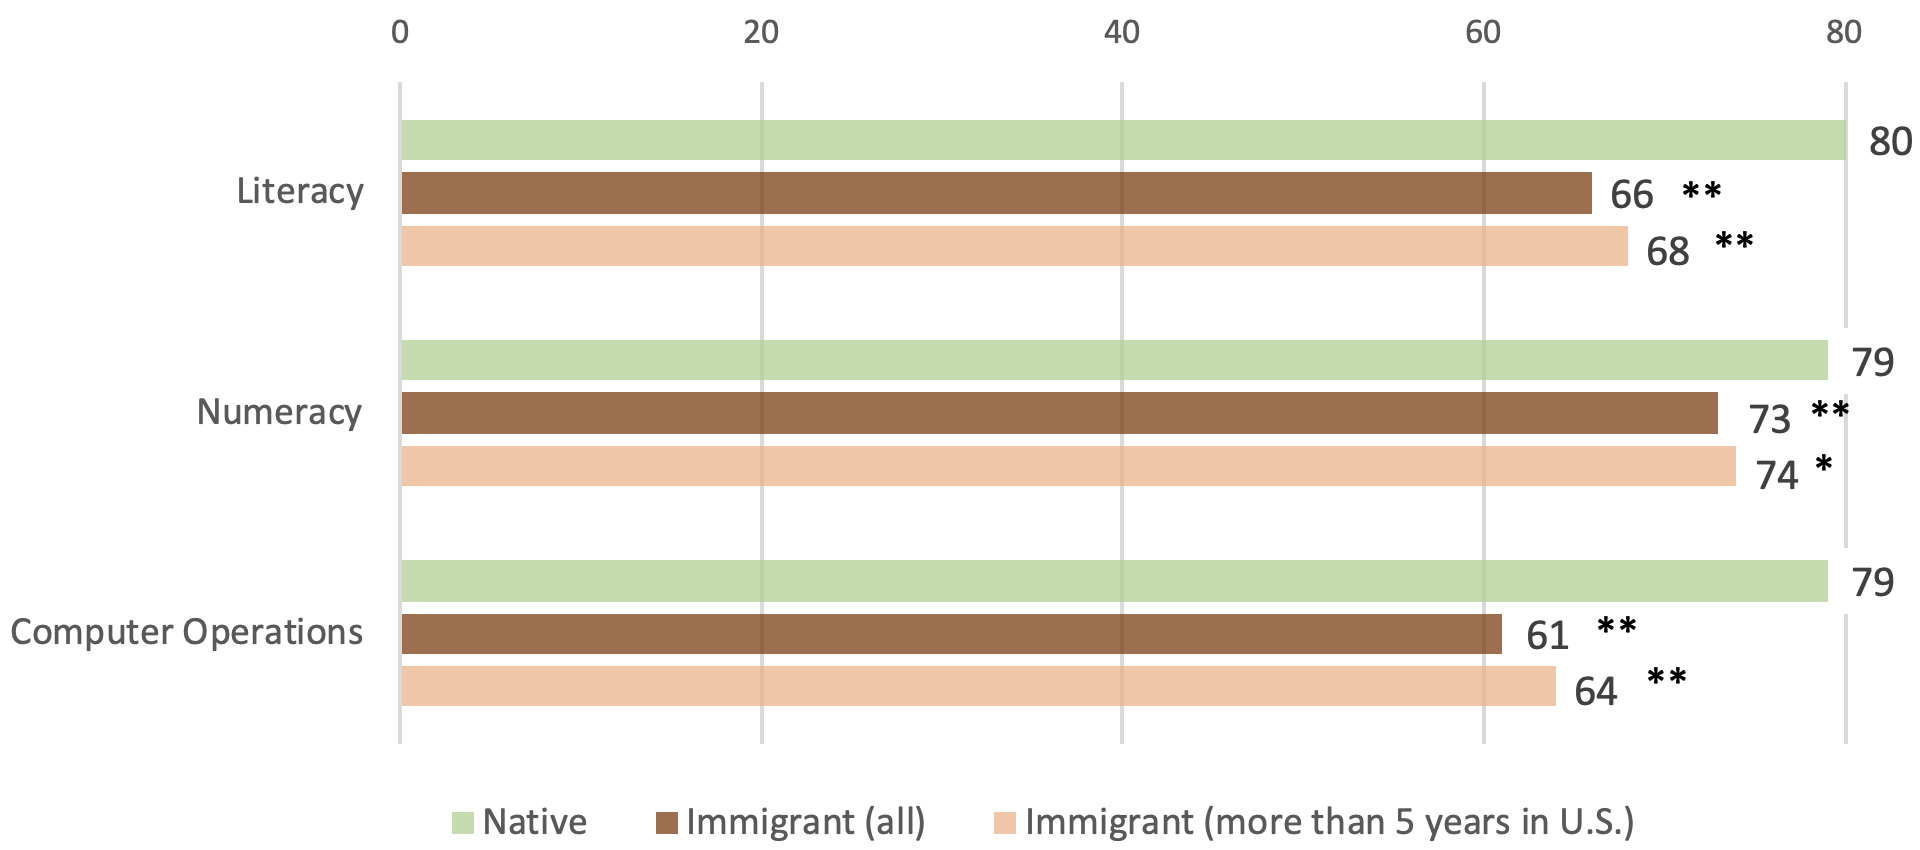
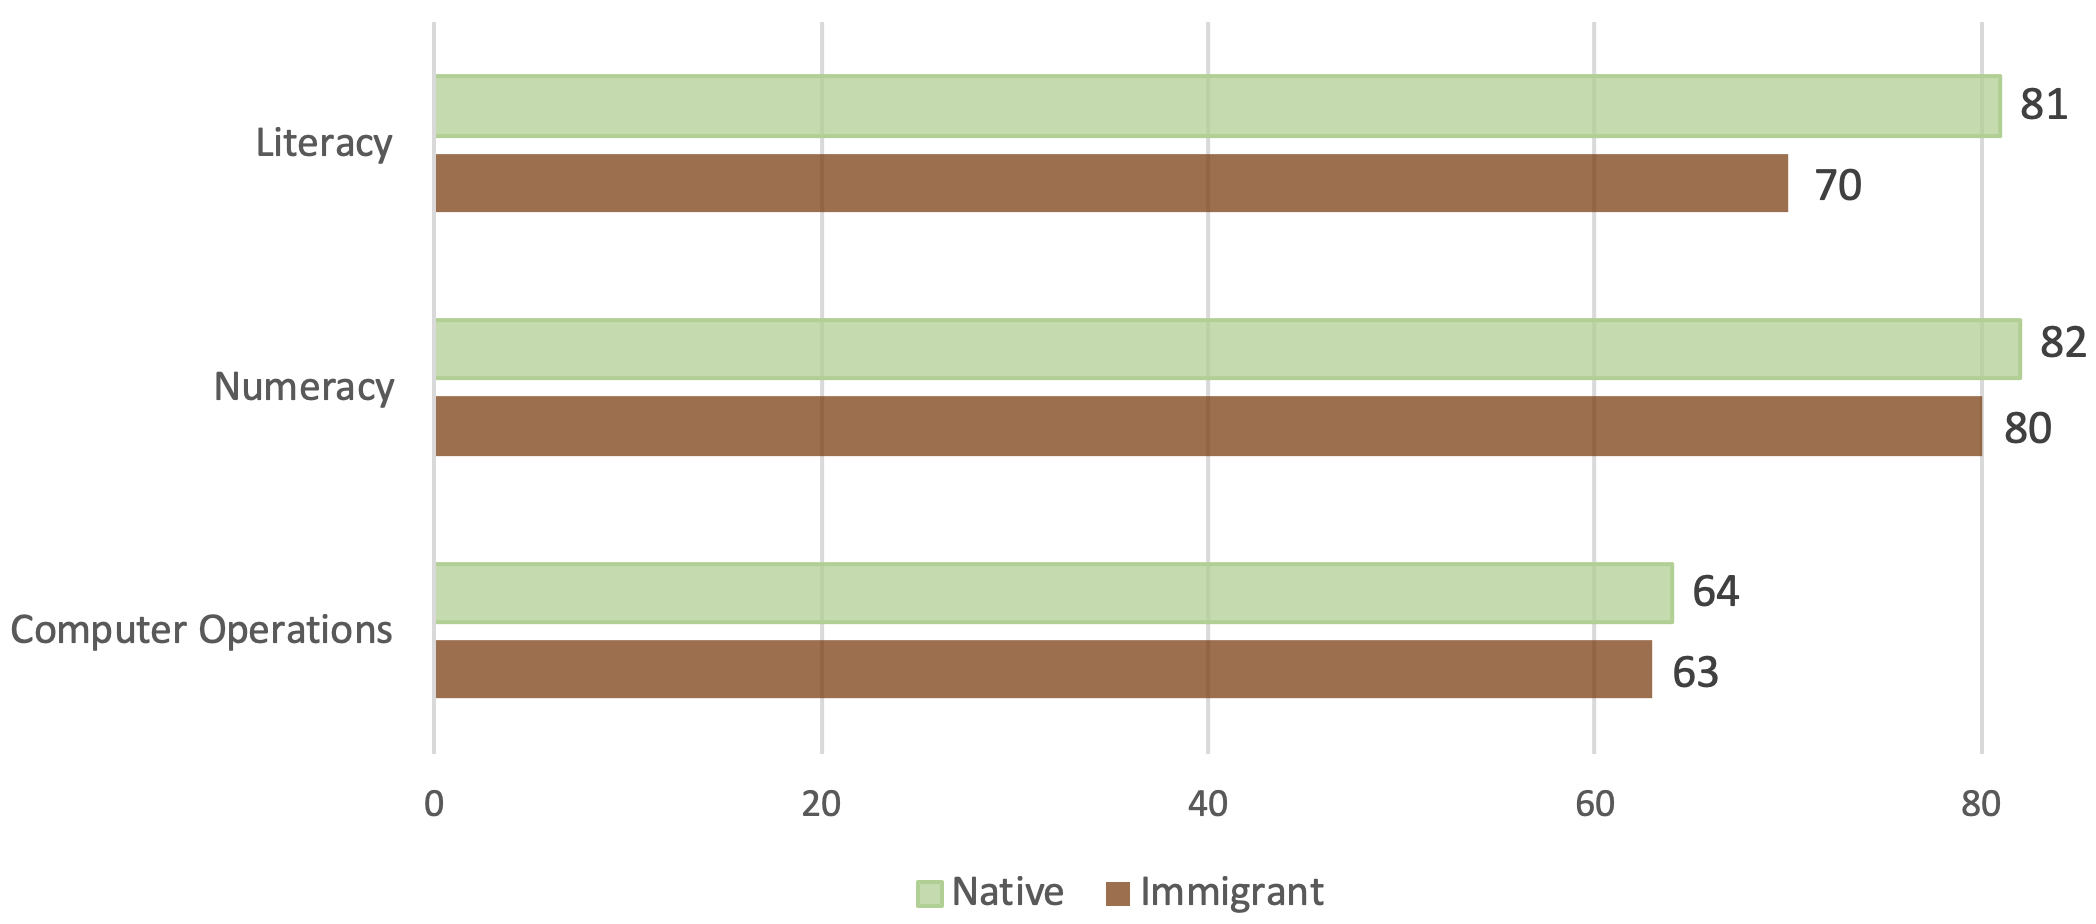
Test Scores. The Program for the International Assessment of Adult Competencies (PIAAC) administers tests of literacy, numeracy, and computer operations.5 Figure 4A shows the percentile scores of immigrants and natives who are doctorate-ready. While both groups score above the U.S. median on each test, doctorate-ready natives outperform doctorate-ready immigrants, even as a higher proportion of immigrants receive doctorates.
Figure 4A. Percentile Ranks on Skill Tests in the "Doctorate-Ready" U.S. Population |
 |
|
Source: Program for the International Assessment of Adult Competencies. The 50th percentile represents the median score of all U.S. adults. "Doctorate-ready" people are ages 26-40 and have at least a bachelor's degree. Foreign doctorates are excluded. * native-immigrant difference significant at p < .05; ** p < .01. |
The scores of immigrants may be depressed because the tests are administered in English. However, immigrants who have lived in the U.S. for more than five years perform only slightly better than the overall immigrant group. Moreover, English ability is itself a skill that is necessary both for U.S. doctoral programs and for most high-paying jobs in the American economy.
What about the test scores of immigrants and natives who actually earn doctorates? Here the PIAAC is limited by sample size. The number of immigrants with U.S. doctorates in the data is approximately 30, which is too small for most analyses. Figure 4B shows that, to the extent that any meaningful conclusion can be drawn, test scores of natives and immigrants with U.S. doctorates are similar.
Figure 4B. Percentile Ranks on Skill Tests Among U.S. Doctorate-Holders |
 |
|
Source: Program for the International Assessment of Adult Competencies. The 50th percentile represents the median score of all U.S. adults. Scores are controlled for the year the doctorate was awarded. None of the native-immigrant differences are statistically significant. |
Wages. Another way to assess the skills of immigrants who receive U.S. doctorates is to compare their wages to those of natives who also have doctorates. Here the data set of choice is the Survey of Doctorate Recipients (SDR), which collects detailed earnings and demographic information on existing U.S. doctorate-holders up to the age of 75, including those who no longer live in the U.S. The SDR’s public-use microdata, though limited, provides enough information to run a wage regression that controls for a basic set of covariates.6
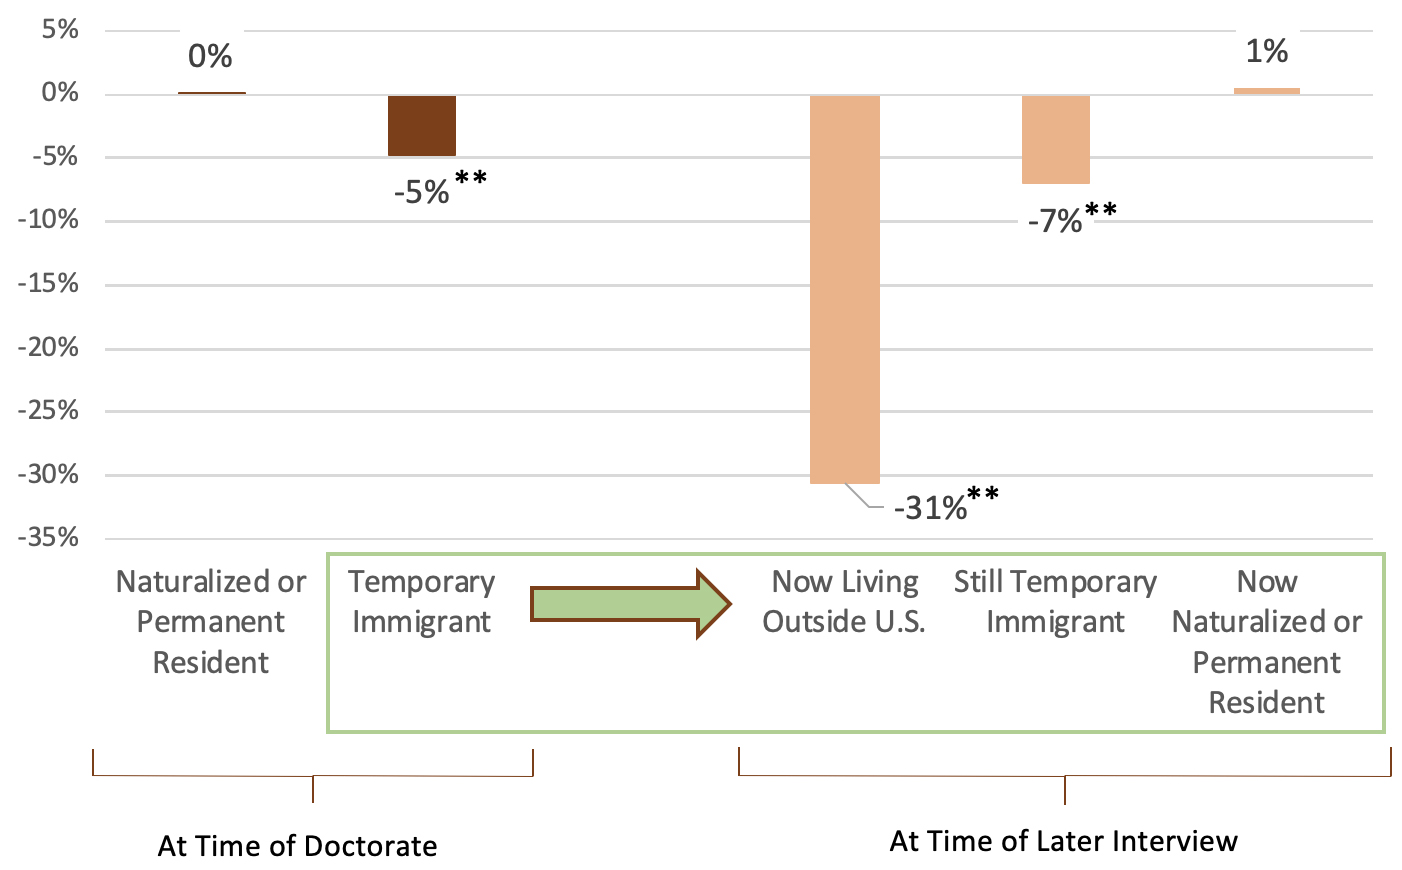
Figure 5. Among U.S. Doctorate-Holders, Immigrant Wage Advantage (+) or Disadvantage (-) vs. Comparable Natives |
 |
|
Source: Survey of Doctorate Recipients. Comparisons are controlled for demographic differences; see text for details. * Native-immigrant difference significant at p < .05; ** p < .01. |
The two leftmost bars in Figure 5 reflect the visa status of doctorate holders at the time they received their degrees. Among U.S. doctorate-holders, permanent residents and naturalized citizens earn the same as comparable natives, while temporary immigrants earn 5 percent less.
The interpretation of the temporary category is tricky, however. As the three rightmost bars in Figure 5 indicate, the temporary category combines groups whose immigration status changed in different ways after initially acquiring a student visa. About 58 percent of doctorate recipients in the SDR who had student visas have since become permanent residents or naturalized citizens. According to Figure 5, this group earns 1 percent more than comparable natives. By contrast, 11 percent are still here on a temporary basis, and they earn 7 percent less than natives. The remainder have left the U.S. entirely and experience a wage penalty of 31 percent compared to U.S. natives.
It would be naïve to assume that the wage differences among the three subgroups listed above are due entirely to skill differences. After all, those who have left the U.S. probably work in a less profitable labor market, and those who are still temporary U.S. residents may be limited in their ability to change jobs and bargain for higher wages.
It would be equally naïve, however, to assume that the student visa holders who became naturalized or permanent residents — the ones who face the least restrictions in the U.S. labor market — reflect the “true” skill level of the student-visa group as a whole (if only they all had permanent residence). When doctorate recipients leave the U.S. or continue to live here only on a temporary basis, their immigration status may reflect, in part, the lesser marketability of their skills compared to permanent U.S. residents. In any case, the wage results provide no evidence that immigrants with U.S. doctorates are more skilled than their native counterparts.
Patents. Another common measure of immigrant skills is the number of patents they produce. The SDR does not ask respondents about patents, but back in 2003 the National Survey of College Graduates (NSCG) did ask. In a raw comparison using NSCG data, immigrants with U.S. doctorates produced significantly more patents than natives with doctorates. If the research question is about technological innovation, that comparison might be the most relevant. As a measure of marketable skills, however, patents are context-dependent. Two graduates of equal ability might produce very different numbers of patents if, for example, one is an engineer and the other is an epidemiologist. It’s therefore necessary to apply a set of control variables similar to the wage analysis above, including the broad field of study.7
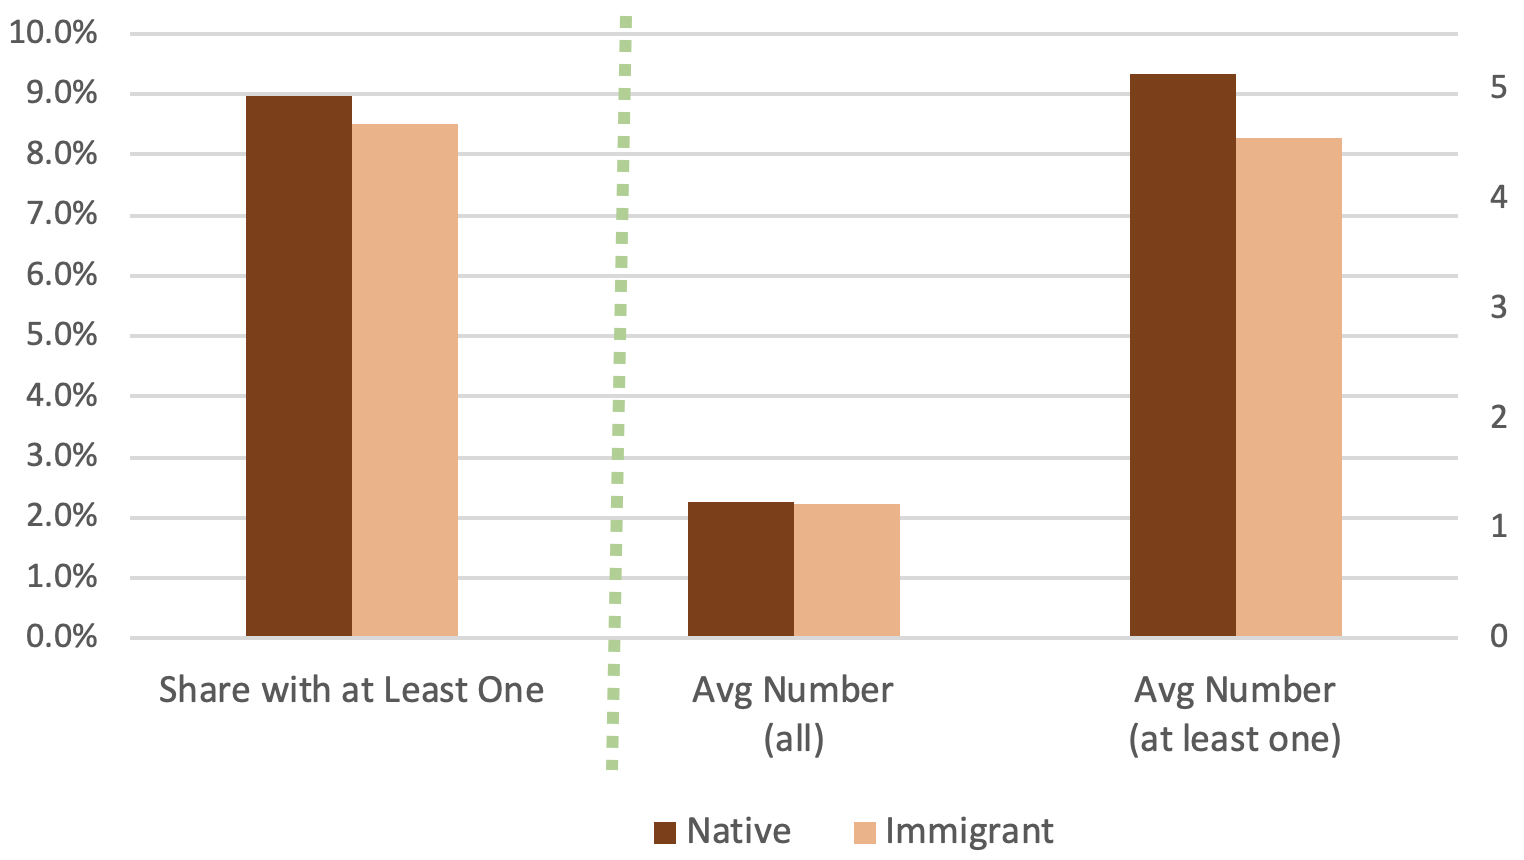
Figure 6 compares patent production between immigrants and natives, again limiting the NSCG sample to respondents who have U.S. doctorates, and now applying the controls discussed above. There are no significant differences in the share with at least one patent, in the average number of patents, or in the average number of patents among those who have at least one.
Figure 6. Patent Production by U.S. Doctorate-Holders |
 |
|
Source: 2003 National Survey of College Graduates. Patent shares and counts are controlled for field of study and other factors; see text for details. None of the native-immigrant differences are statistically significant. |
Discussion
As a group, immigrants who obtain U.S. doctorates have close to or roughly the same skills as native-born doctorate recipients. They are neither underachievers nor whiz kids. Of course, even mediocre doctorate-holders are substantially more skilled than the average American, and the U.S. certainly benefits in some ways from their presence. However, there are also some reasons for concern.
The first concern is the potential crowd-out of natives from doctoral programs. We saw in Figure 4A that doctorate-ready natives have higher test scores than comparable immigrants, but Figure 3 shows that the latter group obtains doctorates at a higher rate. Figure 3 also shows a recent decline in doctorate completion among natives. These results suggest (but certainly do not prove) that a form of crowd-out could be occurring, with relatively average doctoral students from abroad replacing natives.
The academic evidence on crowd-out is mixed. On the optimistic side, some researchers believe that foreign students who pay full tuition actually subsidize additional slots for native students. This “crowd-in” effect is mainly due to master’s students, however.8 A 2008 study that focused specifically on doctorates found that more immigrant doctorates in a given year were associated with more native doctorates in science and engineering fields, but fewer native doctorates in other fields.9 Another study showed that foreign graduate students were correlated with enrollment declines among non-Hispanic white men, even when there is no broader crowd-out effect observed.10 In general, crowd-out is more likely at top graduate programs where the funding and available slots are largely fixed, while lower-ranked schools may be more willing to expand to accommodate foreign students who pay full tuition.11
Disentangling this research will require assessing the timing of potential crowd-out, which may occur with a significant lag. For example, one theory is that when wages for science and engineering occupations became relatively less competitive around the turn of the millennium, native interest in pursuing doctoral studies in those fields dropped. The availability of immigrant doctoral students then prevented the wage increases that might have lured natives back in.12 Now the prevalence of immigrants in science and engineering makes it appear that the U.S. “needs” immigrants to compete in those fields, when in reality the labor market could adjust in their absence to attract natives. Overall, crowd-out in doctoral programs does appear to be a real phenomenon, but its effects vary depending on which students, programs, and time periods are considered.
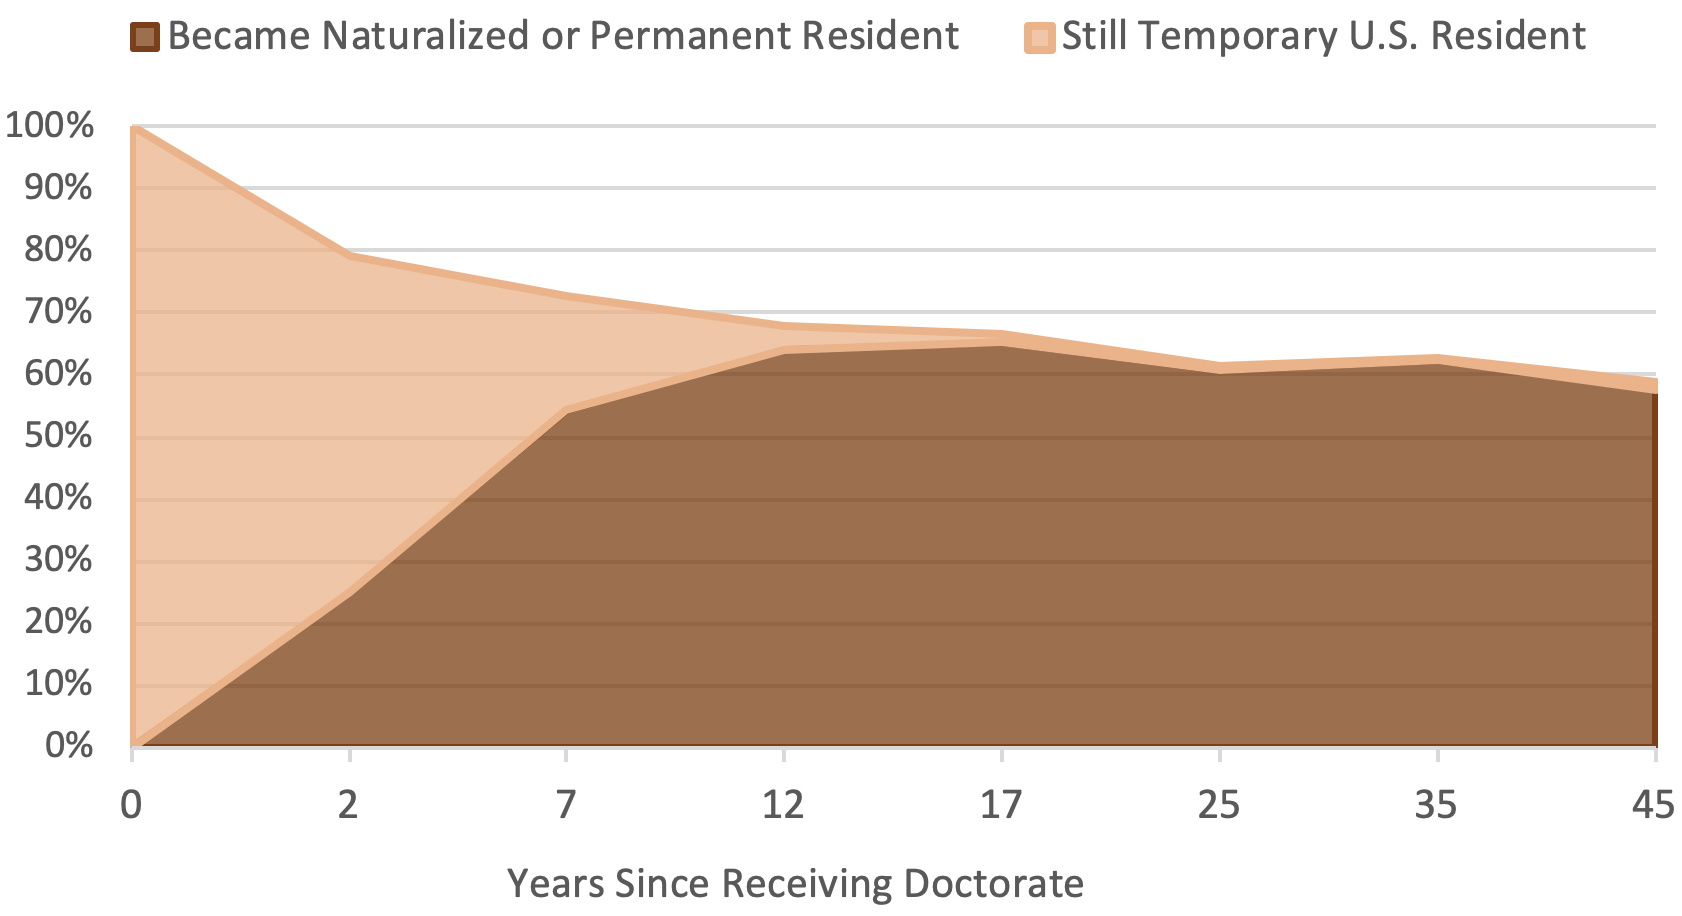
A second concern is that the student visa is a common entry point for immigrants who go on to obtain various skill-based work visas, which often lead to green cards. In fact, Figure 7 shows that, a decade after earning their U.S. doctorates, about 60 percent of former student-visa holders have obtained permanent residency.
Figure 7. Percentage of Student Visa-Holders Who Remain in U.S. after Receiving U.S. Doctorate |
 |
|
Source: 2019 Survey of Earned Doctorates. |
Are the relatively average doctorate-holders profiled in this report really the most talented immigrants available to fill these slots? Granted, if the goal is to raise the skill level of the U.S. population by welcoming as many educated immigrants as possible, then taking in mediocre doctorate recipients is no concern at all, since they clearly boost the average. However, for those who prefer a more limited immigration policy — one that welcomes a handful of Einsteins but keeps the overall numbers low to facilitate assimilation — it’s important to ensure that “the best and brightest” immigrants are truly the best and brightest.
A final concern relates to inviting even more former student-visa holders to stay. The U.S. should “staple a green card” to their diplomas, according to various proposals in Congress.13 The trouble is that the majority of doctorate recipients already find a way to stay, and, as discussed earlier, the current leavers may be less skilled on average than the stayers. If the goal is to recruit Einstein-level talents, “staple a green card” is not the way to do it. In fact, as long as the student visa is a common entry point for a permanent stay, the U.S. should consider setting minimum academic qualifications for the visa that are stricter than what the average university requires for admission.
Skills aside, admitting foreign students also introduces concerns related to culture, politics, and national security. This report does not address those issues. What it does provide is important context for further discussion — specifically, the disproportionate share of foreign students in doctoral programs and their relatively average performance upon graduation.
End Notes
1 The SED counts the number of people who earn research doctorates at U.S. academic institutions each year. These doctorates consist of PhDs or similar credentials in the physical and social sciences. (Professional degrees such as an MD or JD are not included, even though they have “doctor” in their names.) The SED is a complete count of new doctorates — not merely a sample — and it began recording the immigration status of recipients in 1974.
Interpreting SED data across time does require a couple of caveats. First, the SED stopped counting most doctor of education (EdD) degrees in 2010 after determining they were primarily for professional training rather than research. As a result, the fraction of EdDs in the SED data dropped from 5.5 percent to less than 1 percent. Second, and more importantly, the SED improved its collection of citizenship data in 1990, resulting in a small but noticeable jump in the foreign-born count that year. See the National Center for Science and Engineering Statistics’ “Survey of Earned Doctorates” for more information.
Access to the raw SED data is restricted. However, the National Science Foundation, working with its contractor RTI International, provided CIS with separate tabulations of annual doctorates earned by native-born citizens, naturalized citizens, non-citizens on a permanent visa, and non-citizens on a temporary visa.
2 2018 is the most recent year for which DHS has published counts of both temporary visa-holders (“nonimmigrants”) and legal permanent residents in the U.S. population. DHS counts are not perfectly aligned with the ACS because of survey undercount and differences in the reference date, but the misalignment should not meaningfully affect Figure 2.
Bryan Baker, “Estimates of the Unauthorized Immigrant Population Residing in the United States: January 2015 – January 2018”, Department of Homeland Security, January 2021.
3 Counts of doctorate-ready individuals have come from the ACS every year since 2001, and from the decennial censuses before that. Counts are interpolated between the decennial census years.
4 Jason Richwine, “Skill Deficits Among Foreign-Educated Immigrants: Evidence from the U.S. PIAAC”, PLOS ONE, Vol. 17, No. 8 (2022).
Jason Richwine, “The Value of Foreign Degrees by Source Country”, Center for Immigration Studies Backgrounder, May 10, 2022.
5 The PIAAC was conducted over three waves of testing that combined to yield a nationally representative sample of about 12,000 Americans, ages 16 to 74, who were tested between 2012 and 2017.
6 The dependent variable in this OLS regression is the log of annualized salary in 2019. The covariates are age (five-year groupings); degree year (five-year groupings); degree field (science, engineering, health); region (West, Midwest, South, North, abroad); sector (academic, government, business); sex; presence of children; and marital status. The analysis is limited to full-time workers.
7 The covariates are age (five-year groupings up until age 49, then age 50+); degree field (seven categories); sector (academic, government, business); and sex. The regressions are limited to individuals who earned their doctorates within the past 10 years.
8 Kevin Shih, “Do International Students Crowd-Out or Cross-Subsidize Americans in Higher Education?”, Journal of Public Economics, Vol. 156 (December 2017), pp. 170-184.
9 Liang Zhang, “Do Foreign Doctorate Recipients Displace U.S. Doctorate Recipients at U.S. Universities?” in Doctoral Education and the Faculty of the Future, Cornell University Press, 2008.
10 George J. Borjas, “Do Foreign Students Crowd Out Native Students from Graduate Programs?”, in Science and the University (Science and Technology in Society), Eds. Paula E. Stephan and Ronald G. Ehrenberg, University of Wisconsin Press, 2007.
11 John Bound, Sarah Turner, and Patrick Walsh, “Internationalization of U.S. Doctorate Education”, in Science and Engineering Careers in the United States: An Analysis of Markets and Employment, Eds. Richard B. Freeman and Daniel L. Goroff, University of Chicago Press, 2009, p. 87.
12 Bound, et al., pp. 89-94
13 See, for example, Michael R. Strain, “Stapling Green Cards to Diplomas: Time to Make This Cliche a Law”, The Atlantic, June 21, 2012, referring to potential recipients as “the world's brightest immigrants”.